
Sizing a Hot-Path Rule Rewrite with Per-Rule Profiling
Rewrite a hot-path rule only when it is among the slowest in its group and takes a large share of the group's time.
The problem
An API quota gate checks each request against the tenant's monthly call limit, and the gate's p99 latency rose as it grew to six rules. Rewriting a rule pays off only when it is among the slowest in its group and also takes a large share of the group's time.
At first the gate only compared usage with the limits of three plans: free, growth, and pro. Later came a block for unknown plans, a flag for free tenants near their quota, and a segment router. Nothing yet shows which rule, if any, pushed p99 up.
Because the gate runs first on every request, its time adds directly to every response's latency. When the rules run in a rules engine, the APM span reports policy evaluation as one number. The rules are data in a policy version. No stack frame carries a rule's name. A CPU profiler sees only the evaluator's own methods and cannot split their time by rule. An average cannot show that either. A rule that is slow only on the few requests with long tag lists disappears into the average, because every other request is fast.
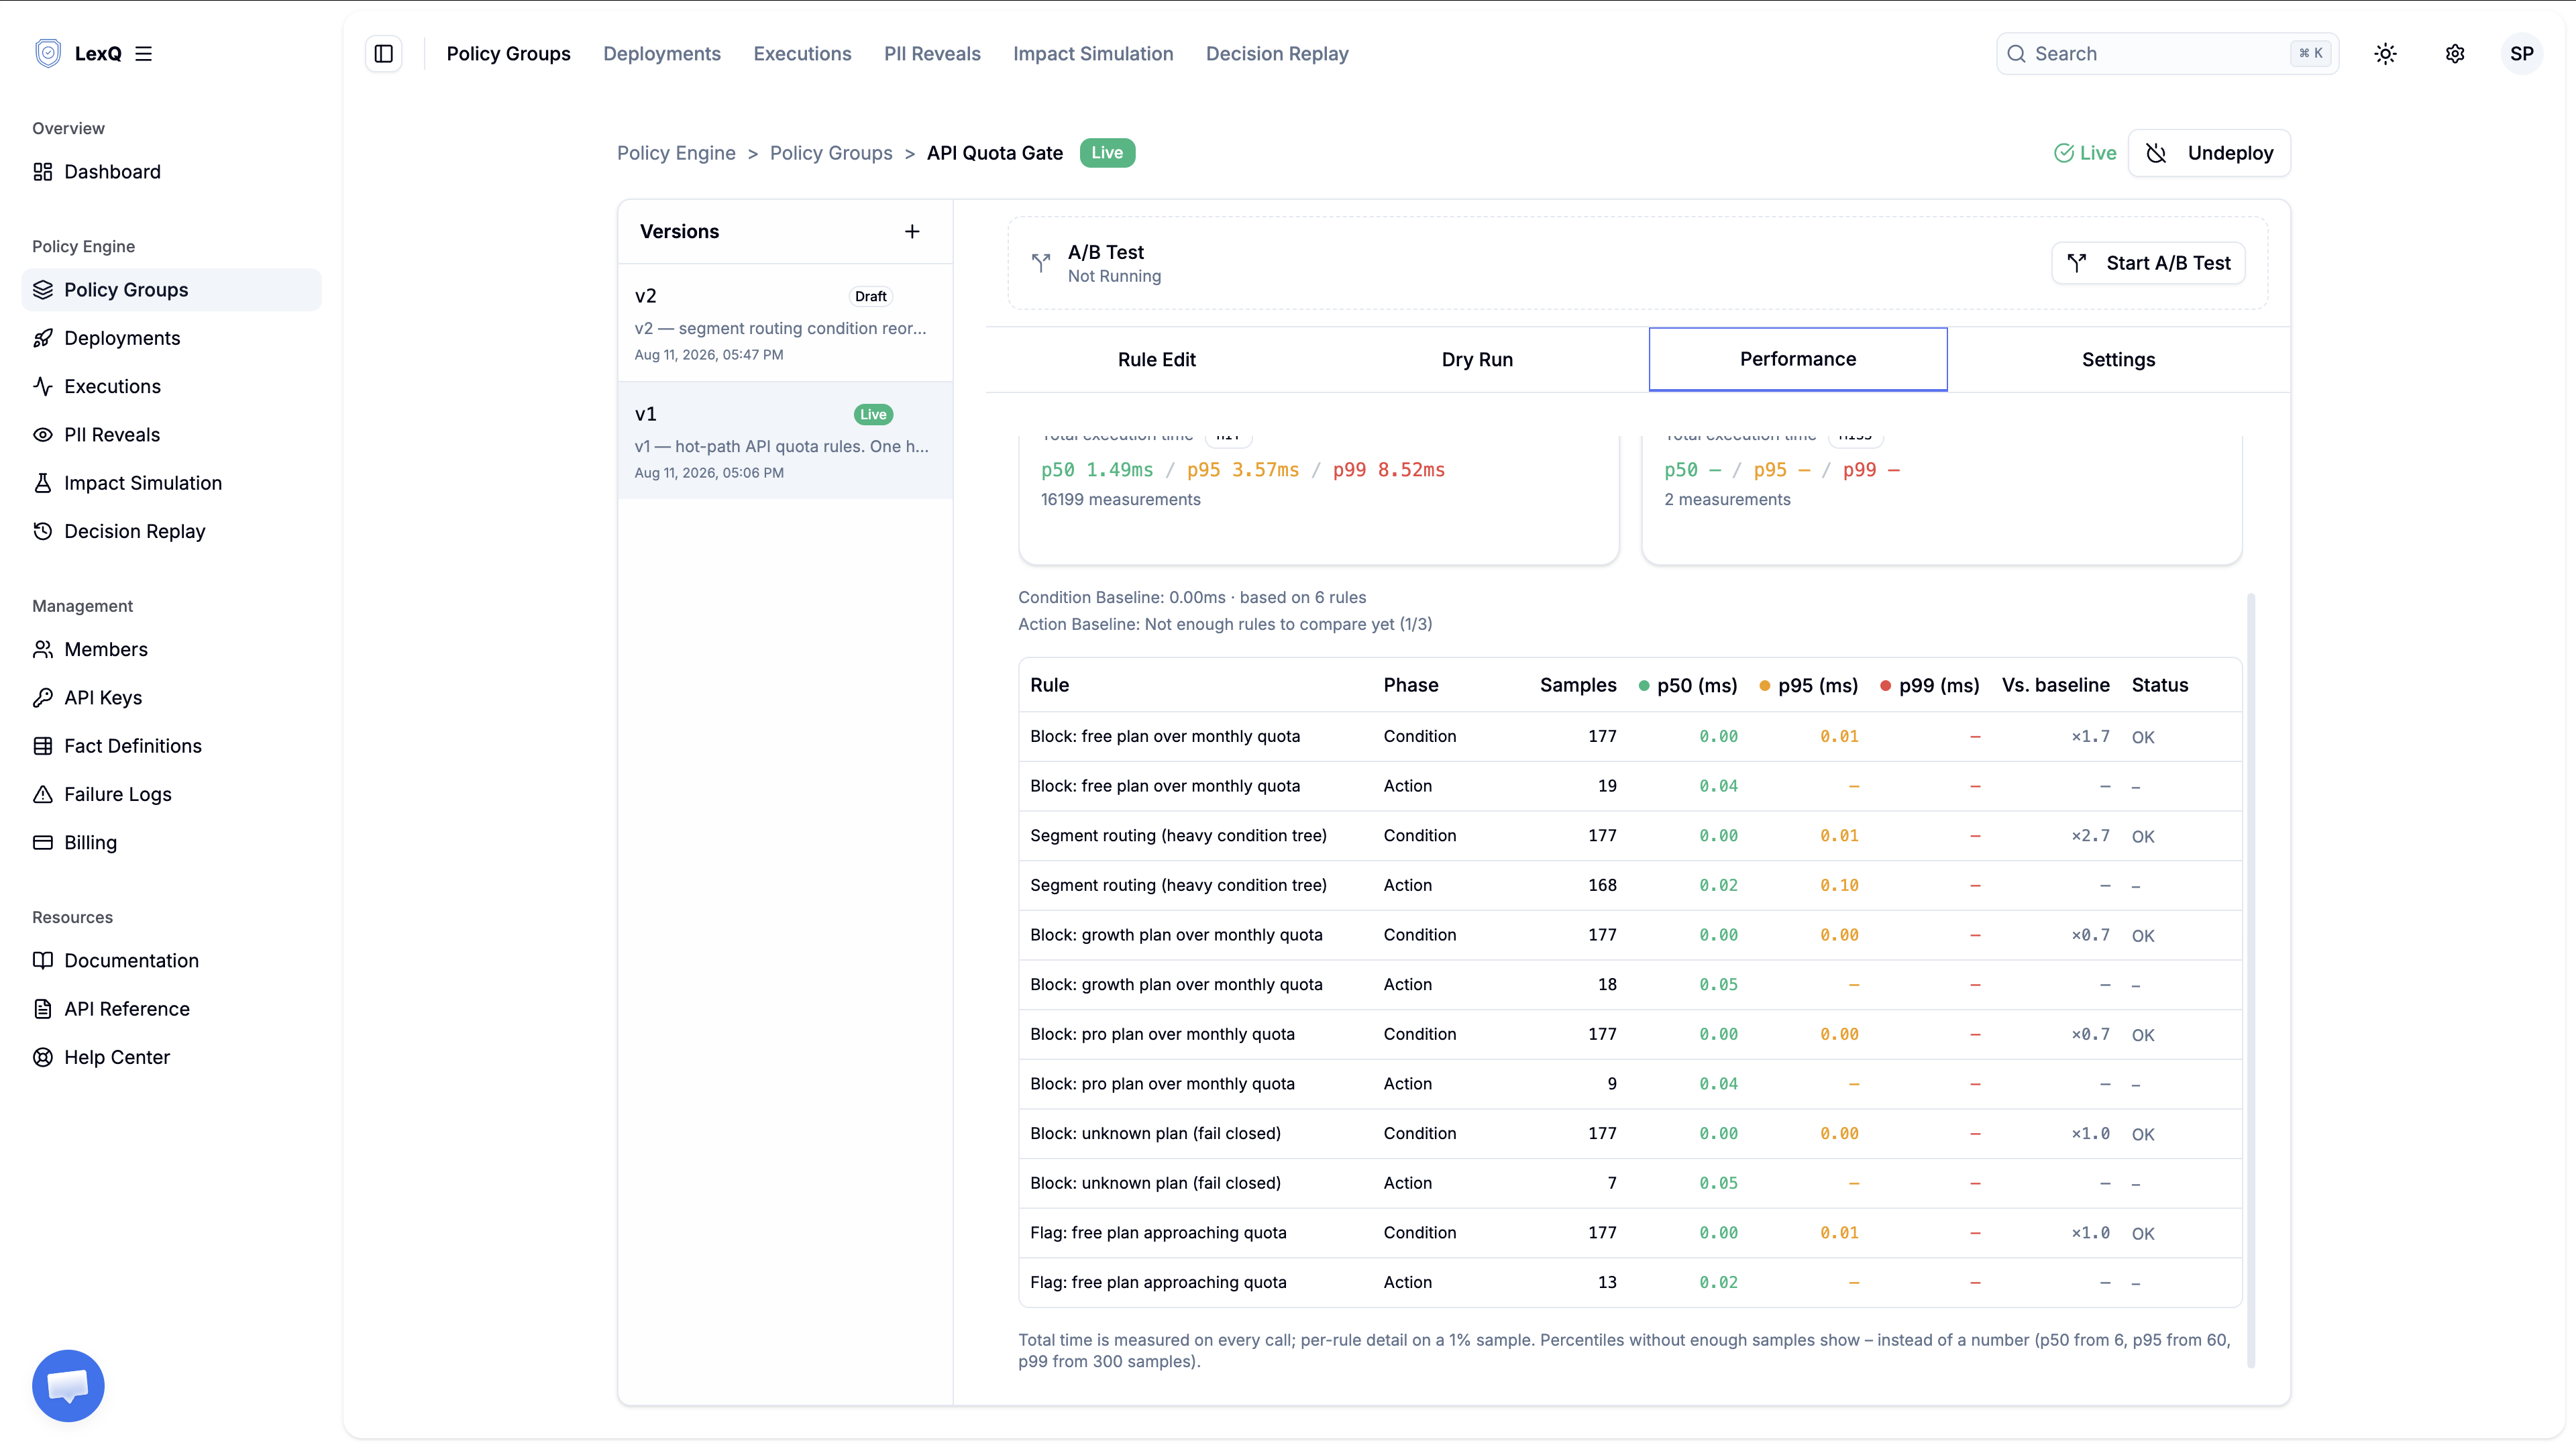
In the example below, the router takes more than twice as long as most of the other rules. Yet of the 811 µs the gate spends on a typical request, the router accounts for about 26 µs, roughly 3%. No rewrite of it can make the gate more than 3% faster.
Is any of the six rules worth rewriting?
The naive approach
The first version keeps the rules in code and times the whole gate.
public class QuotaGate {

    private static final Map<String, Long> QUOTAS =
            Map.of("free", 10_000L, "growth", 100_000L, "pro", 1_000_000L);

    public Decision check(Request req) {
        long t0 = System.nanoTime();
        Decision d = evaluate(req);
        long elapsed = System.nanoTime() - t0;

        // One number for the whole gate.
        // It does not record which branch spent the time.
        log.info("quota_gate_ns={}", elapsed);
        return d;
    }

    private Decision evaluate(Request req) {
        Long quota = QUOTAS.get(req.plan());
        if (quota == null) {
            return Decision.deny("plan outside known plans");
        }
        if (req.callsThisMonth() > quota) {
            return Decision.deny("monthly quota exceeded");
        }
        // Added later, for a rollout. Walks the tag list on every request.
        if (matchesAnySegment(req.tags())) {
            return Decision.allowWithRoute(routeFor(req.tags()));
        }
        return Decision.allow();
    }
}
One timer is enough while the gate only compares plan limits. Once the segment branch is added, the same number mixes a cheap lookup with a tag scan.
quota_gate_ns is the latency of every branch added together. Splitting it means a timer around each if, kept in step with the branches by hand. A reordering that misses one timer breaks the measurement, yet every test still passes.
Log lines yield a mean, or a count of requests over a chosen threshold. Comparing one branch with the others takes percentiles per branch. A log pipeline computes those only when each branch writes its own field.
Requests right after a deploy run slower. The first few pay for loading the rules and warming up the code, and the next few minutes can stay slower than usual. Counted with everything else, that one-off cost looks like occasional very slow requests and pushes p99 up.
None of these numbers says whether rewriting the branch that looks slowest would change the gate's total.
Defining the pattern
The engine times every rule during evaluation and reports each rule's percentiles beside the group's total for the same window. One query then returns both numbers the rewrite decision needs.
The engine times rules on a 1% sample of requests. This pattern therefore fits a group of three or more rules with about 10,000 requests in the window, enough for 100 samples per rule. It does not answer a p99 question until each rule has 300 samples, well over 30,000 requests. Nor does it see a rule getting faster by less than 512 ns.
The middleware sends three facts, the group holds six rules, and the engine times each rule in two phases:
- Facts:
tenantPlan,apiCallsThisMonth, anduserTags, passed on every request. - Rules: one block per known plan, a fail-closed block for any other plan, a flag for free tenants near their quota, and a segment router.
- Phases:
CONDITIONis the time to evaluate a rule's condition tree.ACTIONis the time to run the actions of a rule that matched.
The four blocks split requests by plan, so at most one of them matches a request. The flag and the router each write a fact of their own, quotaWarning and segmentRoute. Since no match has to beat another, the group needs no mutex group to pick a winner. Register quotaWarning and segmentRoute as facts before saving those two rules; a rule that writes to an unregistered key is rejected on save with ACT-032.
{
  "name": "Block: free plan over monthly quota",
  "condition": {
    "type": "GROUP",
    "operator": "AND",
    "children": [
      {
        "type": "SINGLE",
        "field": "tenantPlan",
        "operator": "EQUALS",
        "value": "free",
        "valueType": "STRING"
      },
      {
        "type": "SINGLE",
        "field": "apiCallsThisMonth",
        "operator": "GREATER_THAN",
        "value": 10000,
        "valueType": "NUMBER"
      }
    ]
  },
  "actions": [
    {
      "type": "BLOCK",
      "parameters": {
        "reason": "apiCallsThisMonth exceeds the free plan quota 10000"
      }
    }
  ],
  "isEnabled": true
}
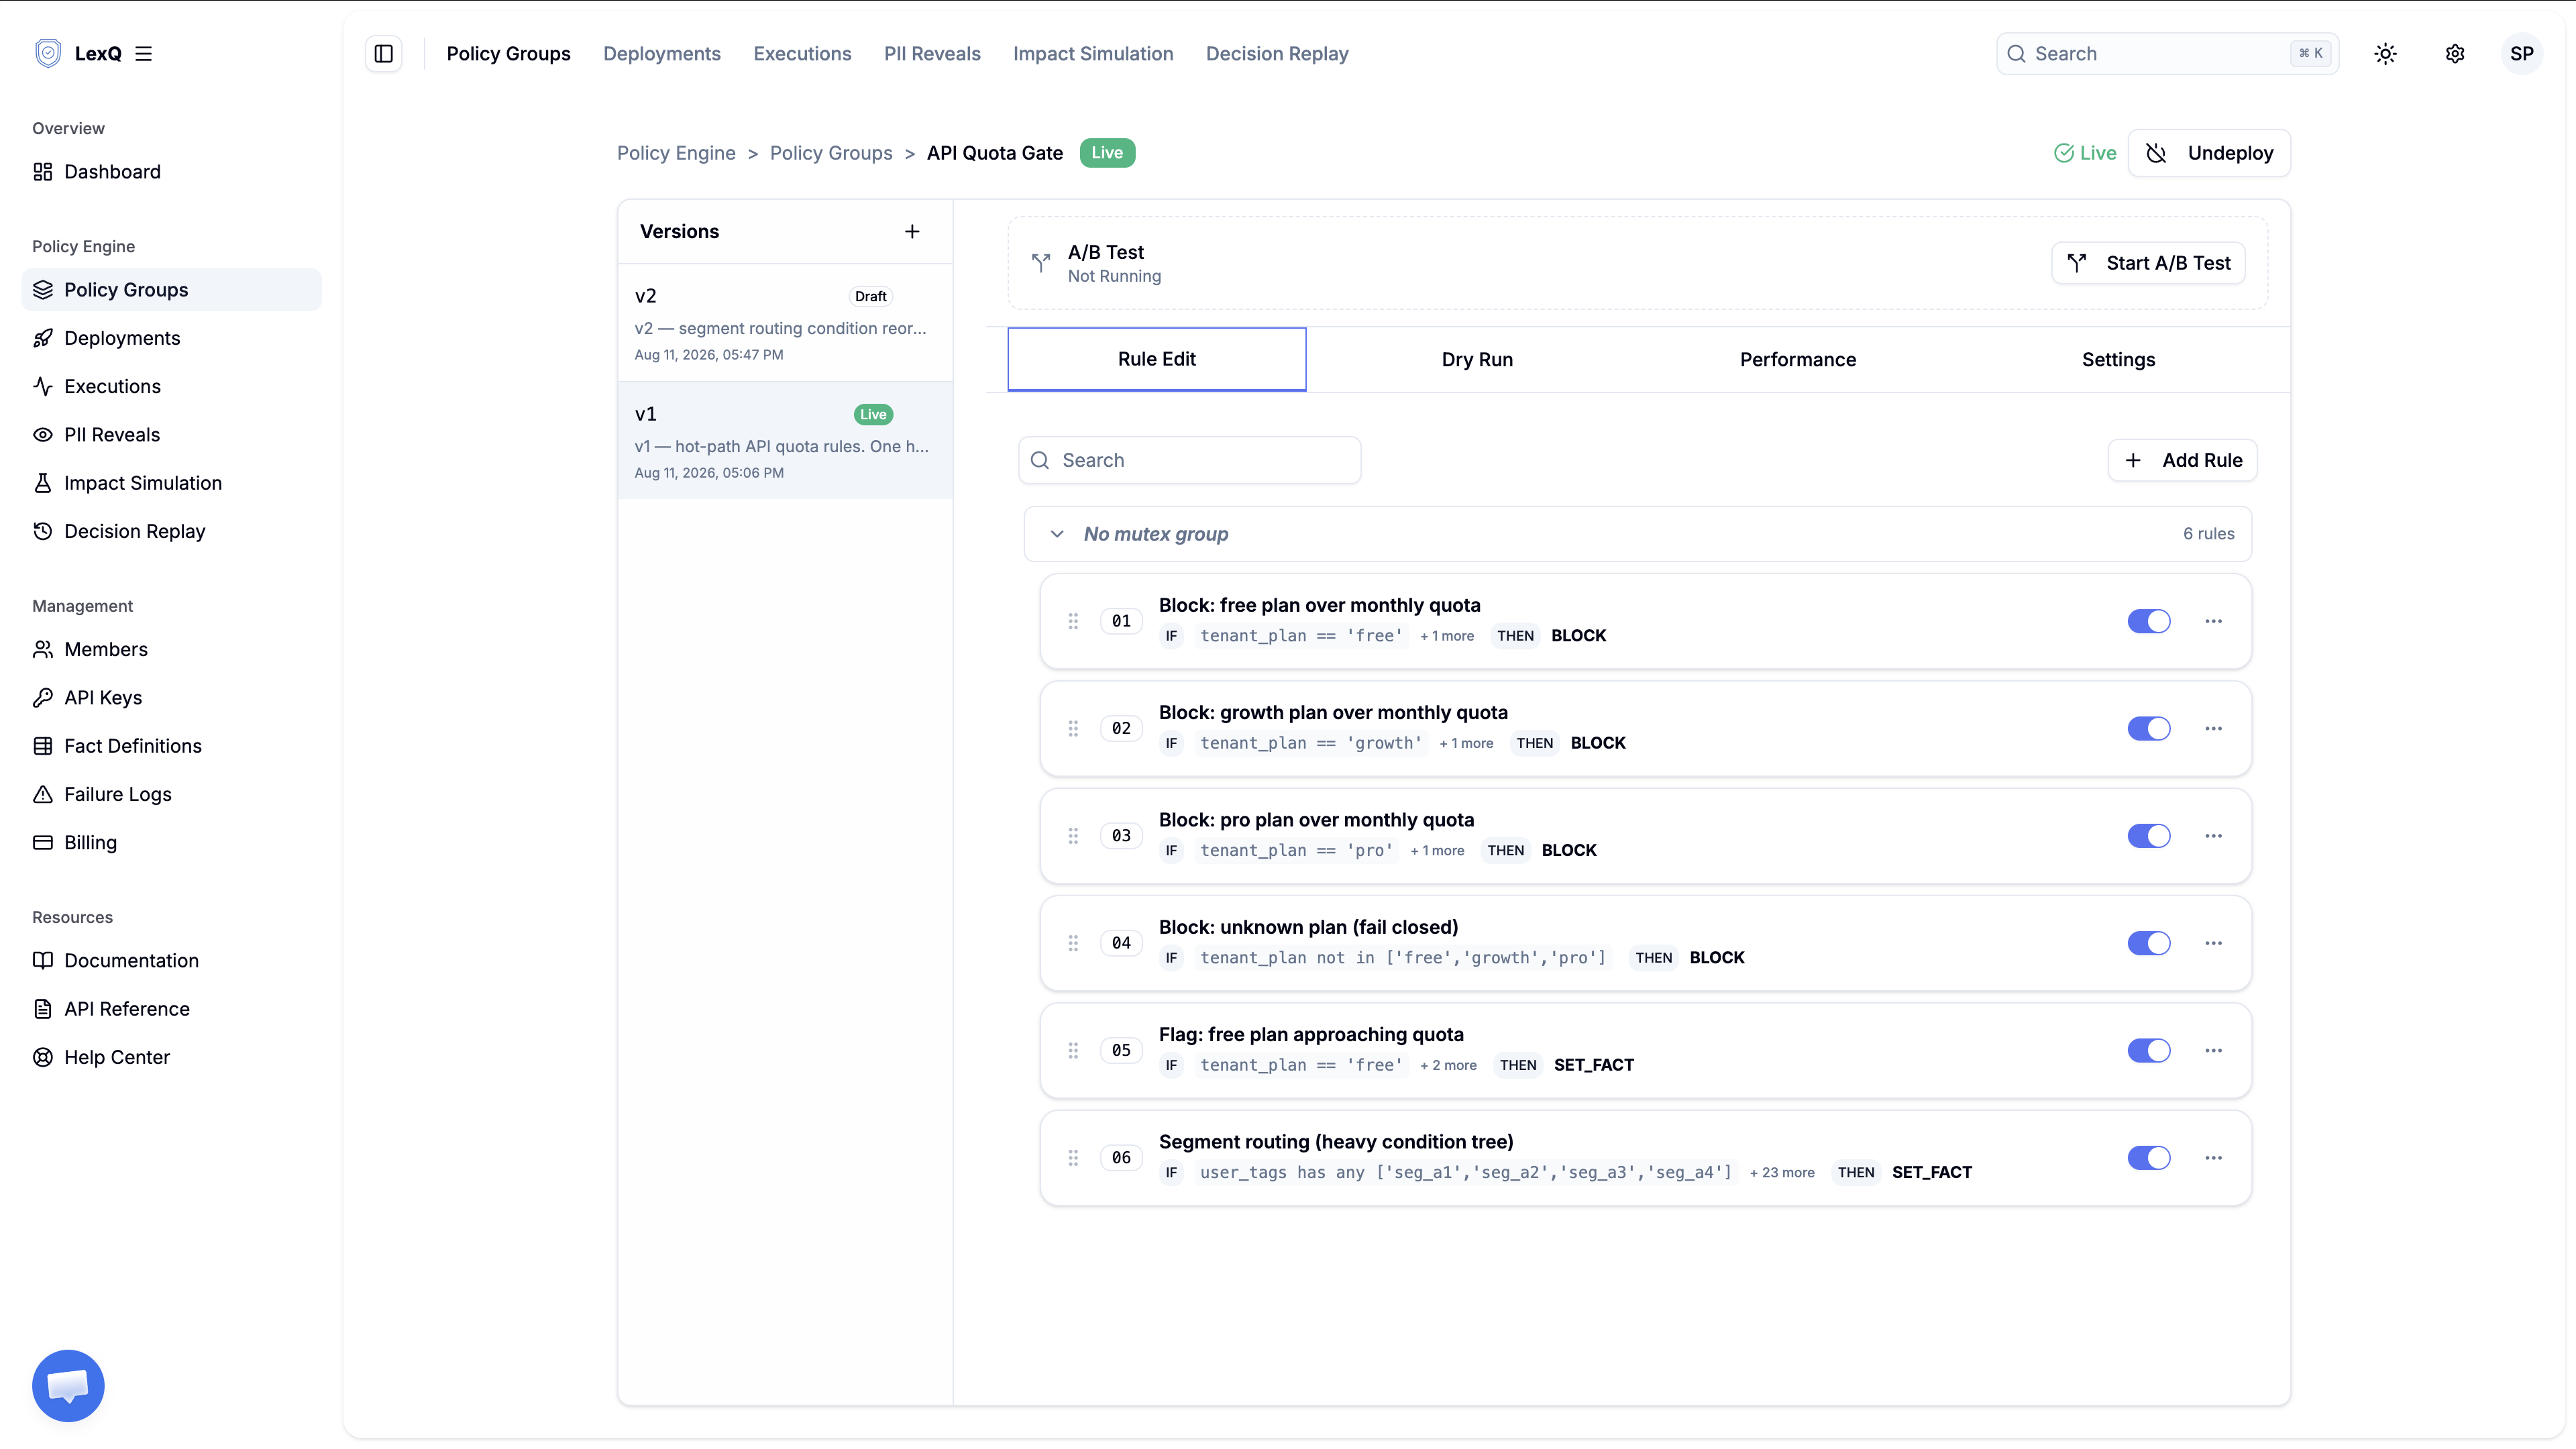
The segment router carries the largest condition in the group. Its condition joins eight sets of checks with OR: the rule matches when any one set passes. Each set first scans the request's userTags for certain tags, then checks apiCallsThisMonth and tenantPlan against fixed values. The three checks are joined by AND. A set passes only when all three hold.
The engine flags a rule when its p50 reaches ten times the median of the per-rule p50s in the same group. It offers no fixed threshold such as "slower than 5 ms". The same rule runs faster or slower on a new host, or after the rules or traffic change. A fixed number in a document does not change with them, and rules end up judged against a limit that no longer fits.
The multiple, a rule's p50 divided by that median, shows how much slower the rule is than the others in its group. The decision also needs the rule's share of the group's total. The profile carries both: a multiple per rule, and the group's p50 over HIT calls, the ones that find the rules already compiled.
Impact Simulation strategy
Given the router's 3% share, the gate's total time will barely change. This run checks whether the edit shortens the router's own condition time. The candidate, v2, copies the live v1 and reverses the order of the checks in all eight sets. The two cheap comparisons then run first, and when one fails, the set skips the slow tag scan. Since a set still passes only when all three checks hold, whatever their order, no decision should change. The simulation has to show that before the edit ships.
Run v2 against the execution logs from October 1, with v1 as the baseline.
lexq analytics simulation start --json '{
  "policyVersionId": "<candidate-version-id>",
  "dataset": {
    "type": "HISTORICAL",
    "source": "EXECUTION_LOGS",
    "from": "2026-10-01",
    "to": "2026-10-01"
  },
  "options": {
    "baselinePolicyVersionId": "<baseline-version-id>",
    "includeRuleStats": true,
    "maxRecords": 50000
  }
}'
The run covers 30,020 records with 0 errors. In both versions 29,200 records match a rule, and no record's outcome changes.
The rule statistics carry the candidate's counts only. The same dataset therefore runs once more against v1 alone. Each of the six rules has the same match count in both runs, from 29,054 for the router down to 371 for the pro-plan block. For sizing a change with the same comparison, see testing a rule change before deploy.
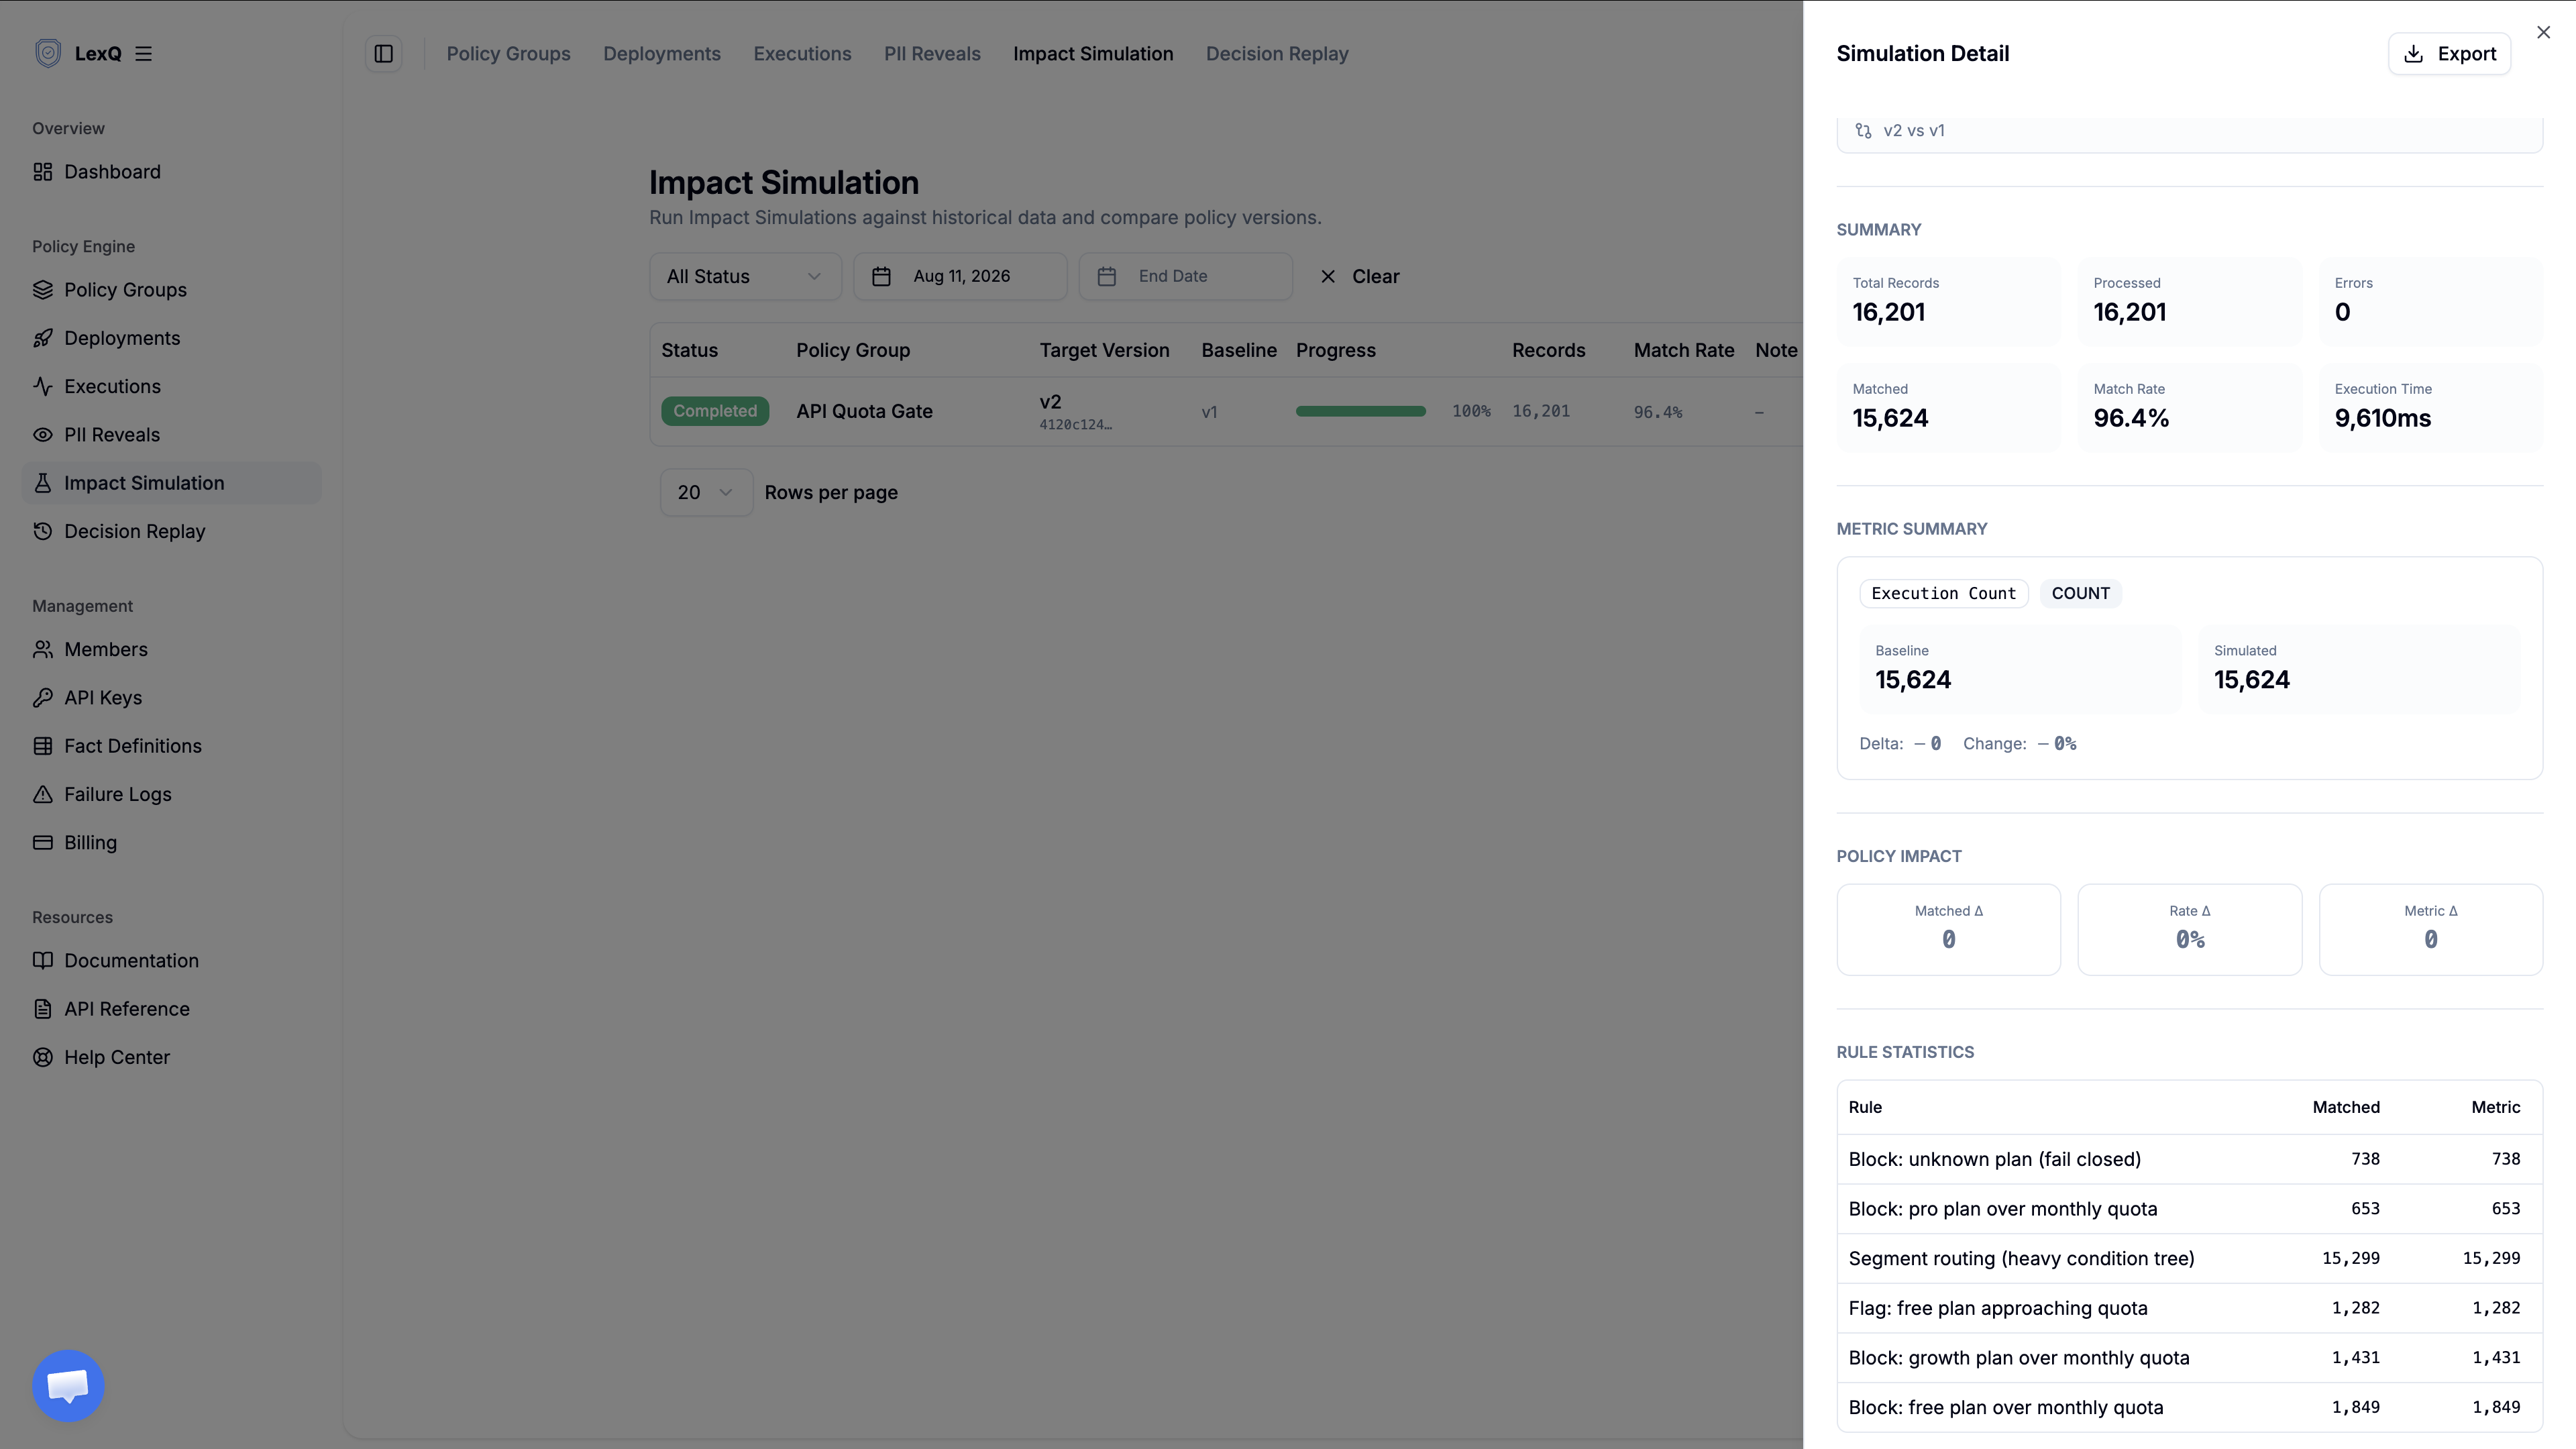
The simulation does not measure latency. It only reports how the results change, so latency has to come from live traffic.
Decision Trace output
Each request leaves an execution record with its decision trace. In it, each quota rule reads NO_MATCH or SELECTED, and a blocked request carries isBlocked and blockReason in generatedVariables. The profile is a second output over the same requests. This profile covers 30,000 requests sent to the live version in two five-minute bursts, with a two-minute pause between them.
{
  "policyGroupId": "<group-id>",
  "policyVersionId": "<live-version-id>",
  "from": "2026-10-01T01:50:00Z",
  "to": "2026-10-01T02:09:00Z",
  "ruleCacheState": "HIT",
  "droppedRows": 0,
  "summary": [
    {
      "cacheState": "HIT",
      "total": { "n": 29995, "minNanos": 34816, "maxNanos": 42467327,
                 "p50Nanos": 811007, "p95Nanos": 1335295, "p99Nanos": 2768895 }
    },
    {
      "cacheState": "MISS",
      "total": { "n": 5, "minNanos": 16711680, "maxNanos": 43778047,
                 "p50Nanos": null, "p95Nanos": null, "p99Nanos": null }
    }
  ],
  "baselines": [
    { "phase": "CONDITION", "baselineP50Nanos": 1535,
      "cohortSize": 6, "status": "OK" },
    { "phase": "ACTION", "baselineP50Nanos": null,
      "cohortSize": 1, "status": "INSUFFICIENT_COHORT" }
  ],
  "rules": [
    {
      "ruleId": "<segment-router>",
      "phases": [
        { "phase": "CONDITION",
          "stats": { "n": 287, "minNanos": 1536, "maxNanos": 69119,
                     "p50Nanos": 3583, "p95Nanos": 9215, "p99Nanos": null },
          "baselineMultiple": 2.334201954397394, "flagged": false },
        { "phase": "ACTION",
          "stats": { "n": 274, "minNanos": 2560, "maxNanos": 163839,
                     "p50Nanos": 23039, "p95Nanos": 68095, "p99Nanos": null },
          "baselineMultiple": null, "flagged": false }
      ]
    },
    {
      "ruleId": "<free-plan-block>",
      "phases": [
        { "phase": "CONDITION",
          "stats": { "n": 287, "minNanos": 1536, "maxNanos": 411647,
                     "p50Nanos": 4607, "p95Nanos": 25599, "p99Nanos": null },
          "baselineMultiple": 3.0013029315960913, "flagged": false },
        { "phase": "ACTION",
          "stats": { "n": 10, "minNanos": 32768, "maxNanos": 156671,
                     "p50Nanos": 42495, "p95Nanos": null, "p99Nanos": null },
          "baselineMultiple": null, "flagged": false }
      ]
    }
  ]
}
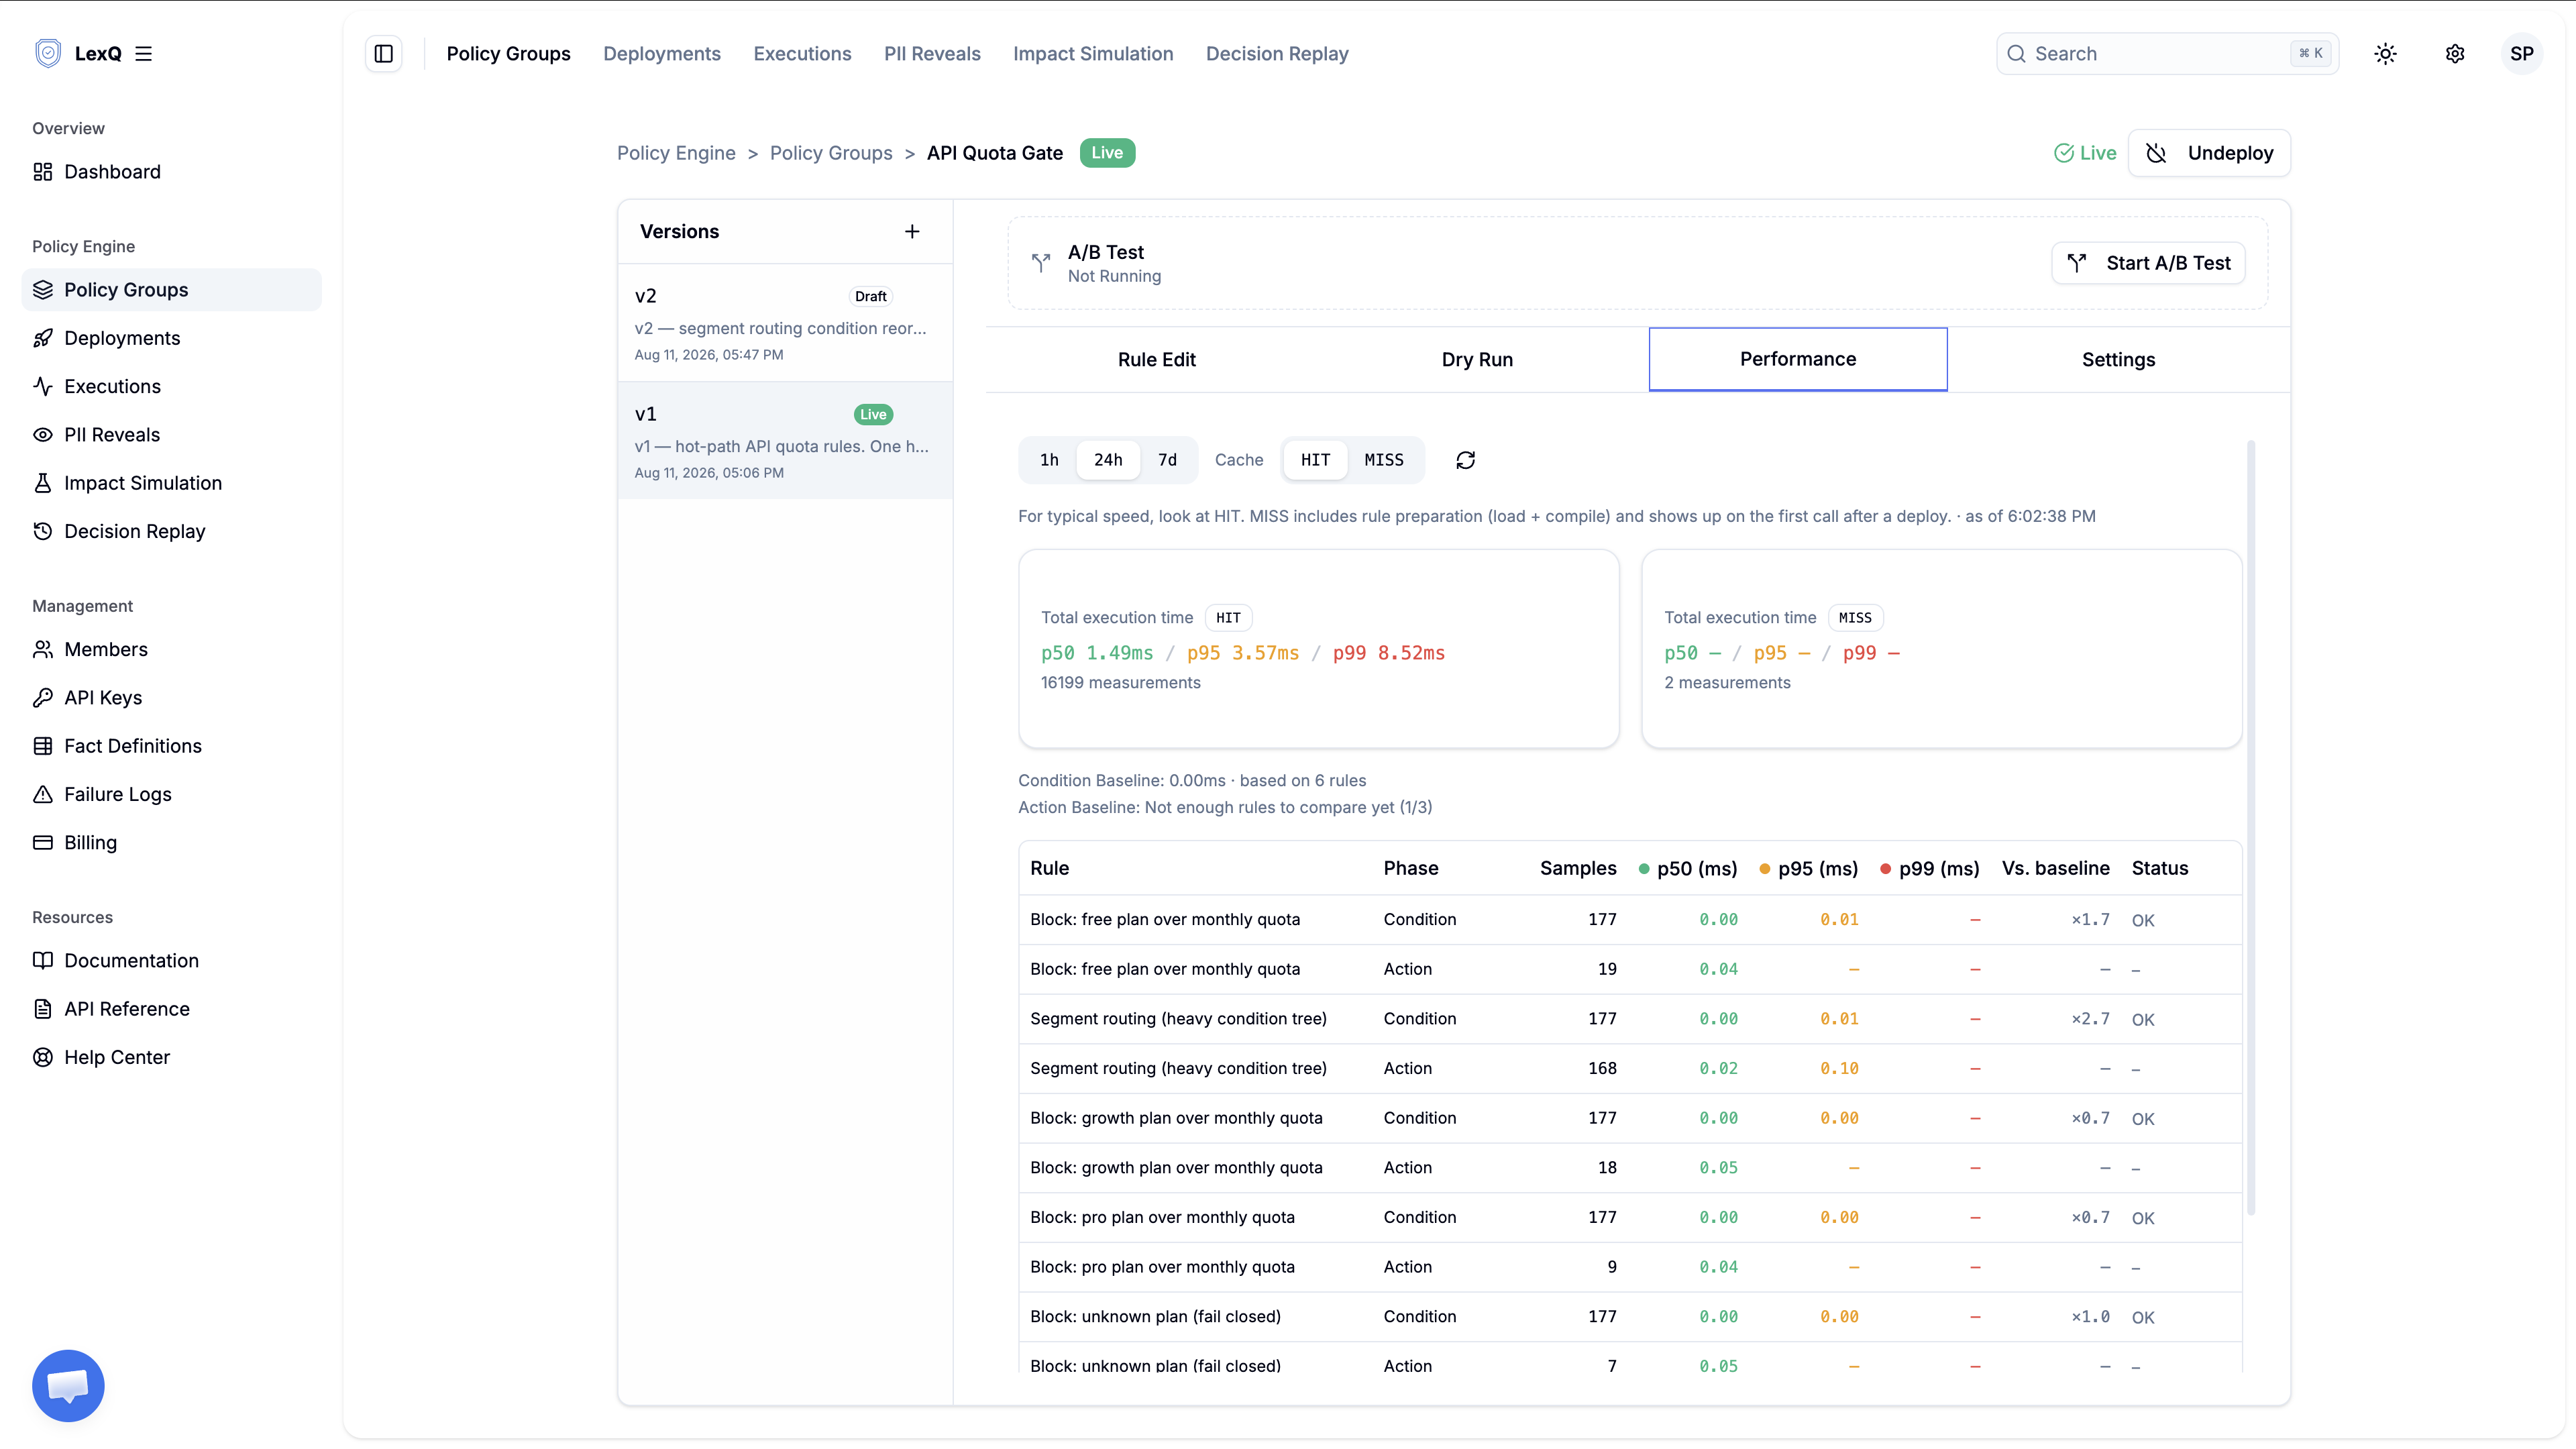
summary is the group total, recorded on every call and split by cache state. baselines holds the median of the per-rule p50s, the denominator of every multiple. droppedRows counts stored windows that could not be read, zero here. Each rule reports its sample count, n, beside its percentiles. The excerpt keeps two of the six rules.
The ranking puts the free-plan block first at 3.00× the median and the router second at 2.33×. The engine flags no rule. The free-plan block's lead comes from the first four minutes of the run. Its per-window p50 reads 7,679 to 27,135 ns during those minutes and 3,071 to 4,095 ns afterward.
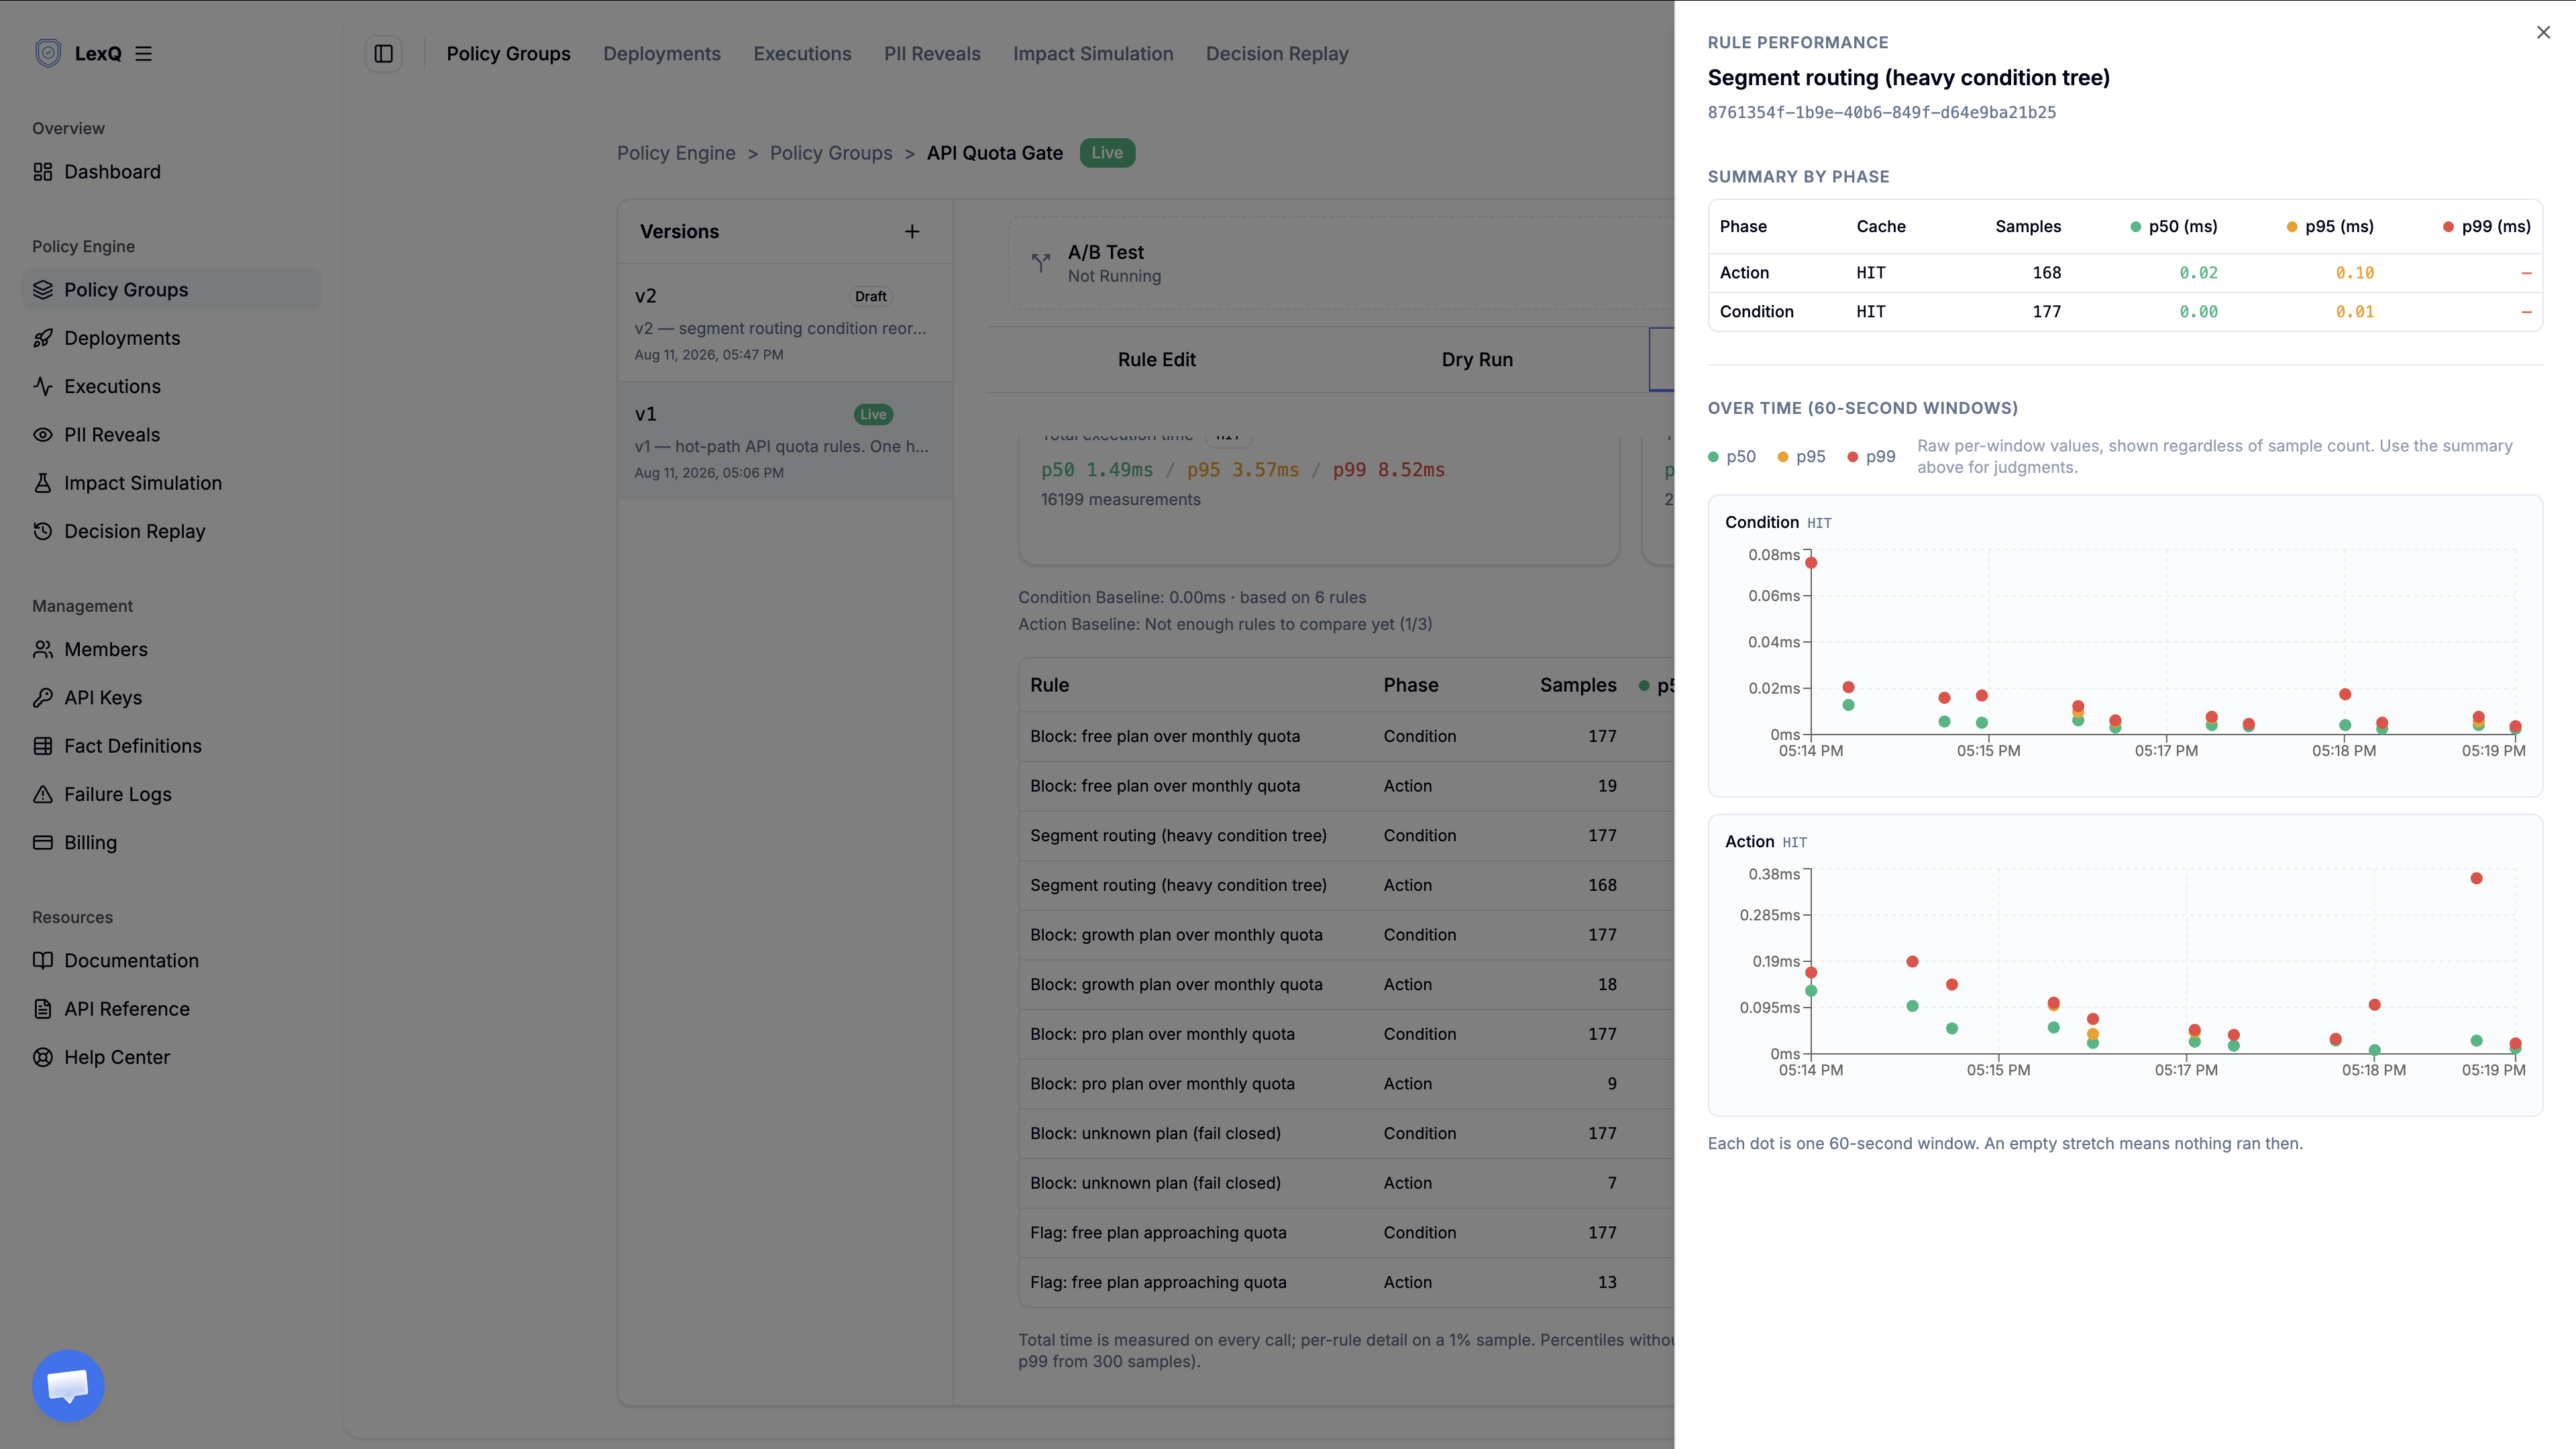
The router's share adds its condition and its action. Its condition p50 is 3,583 ns, its action p50 is 23,039 ns, and the action runs in 274 of the 287 samples. That comes to about 26 µs per request against a group HIT p50 of 811 µs (811,007 ns), roughly 3%. Rewriting one rule can move the group's p50 by at most that rule's share. All six rules together come to about 5%, so most of the gate's time goes to work outside rule evaluation. That work includes checking the incoming facts, settling which matched rules apply, and building the execution record. The profile does not split it further.
Edge cases
Rule detail comes from a deterministic 1% sample, while summary counts every call. Here 30,000 requests yield 287 samples per rule. A percentile stays null until n × (1 − q) ≥ 3: p50 needs 6 samples, p95 needs 60, and p99 needs 300. The router's p99 is null at 287 samples and appears at 307 in the next run. The router's 3% share is therefore measured against a typical request, at p50. The gate's problem is its p99, but a share at p99 needs each rule's own p99, still empty here. A rule joins the comparison only once n ≥ 100. With fewer than three rules past that count, there is too little to compare against. baselines then reports INSUFFICIENT_COHORT, shown in the console as "Not enough rules to compare yet", and the engine computes no multiple.
Actions run only when a rule matches, which leaves their samples uneven. In this group only the router's action reaches 100 samples. The action baseline therefore reports INSUFFICIENT_COHORT, and no action gets a multiple. The router's action is still its larger cost, about six times its condition time. The edit here targets the condition instead, because the action is the rule's output itself and changing it changes what the rule decides. Read action p50s against the group total directly.
MISS is a separate population: calls that load and compile a version. This run has five, from 16.7 to 43.8 ms. The slow first minutes after a deploy are a different effect, and they fall inside HIT. A window that starts at a deploy carries them and can reorder the ranking. The series shows where the values settle, and comparisons belong after that point.
A multiple moves when the other rules in its group move. After the edit, the router's condition p50 stays at 3,583 ns, yet its multiple rises from 2.33× to 3.50×. The group median falls from 1,535 to 1,023 ns. Under about 131 µs the profile counts time in 512 ns steps and reports each percentile as the top of its step. So 3,583 ns covers 3,072 to 3,583 ns, and the median moves down one step. Judge a change by the rule's own p50 across windows of equal length. The multiple only ranks rules.
The series is not smoothed. Each point is one 60-second window from one engine process. Unlike the table, the series applies no minimum sample count: a window with a single sample shows it as its p50, p95, and p99. A window with no samples leaves a gap: the two-minute pause between the bursts shows as the empty stretch in the upper chart above.
Production rollout
The edit changes no decision, so v2 replaces v1 in one deploy. The deploy memo records the profile from before the edit, the expected outcome, and the condition for rolling back.
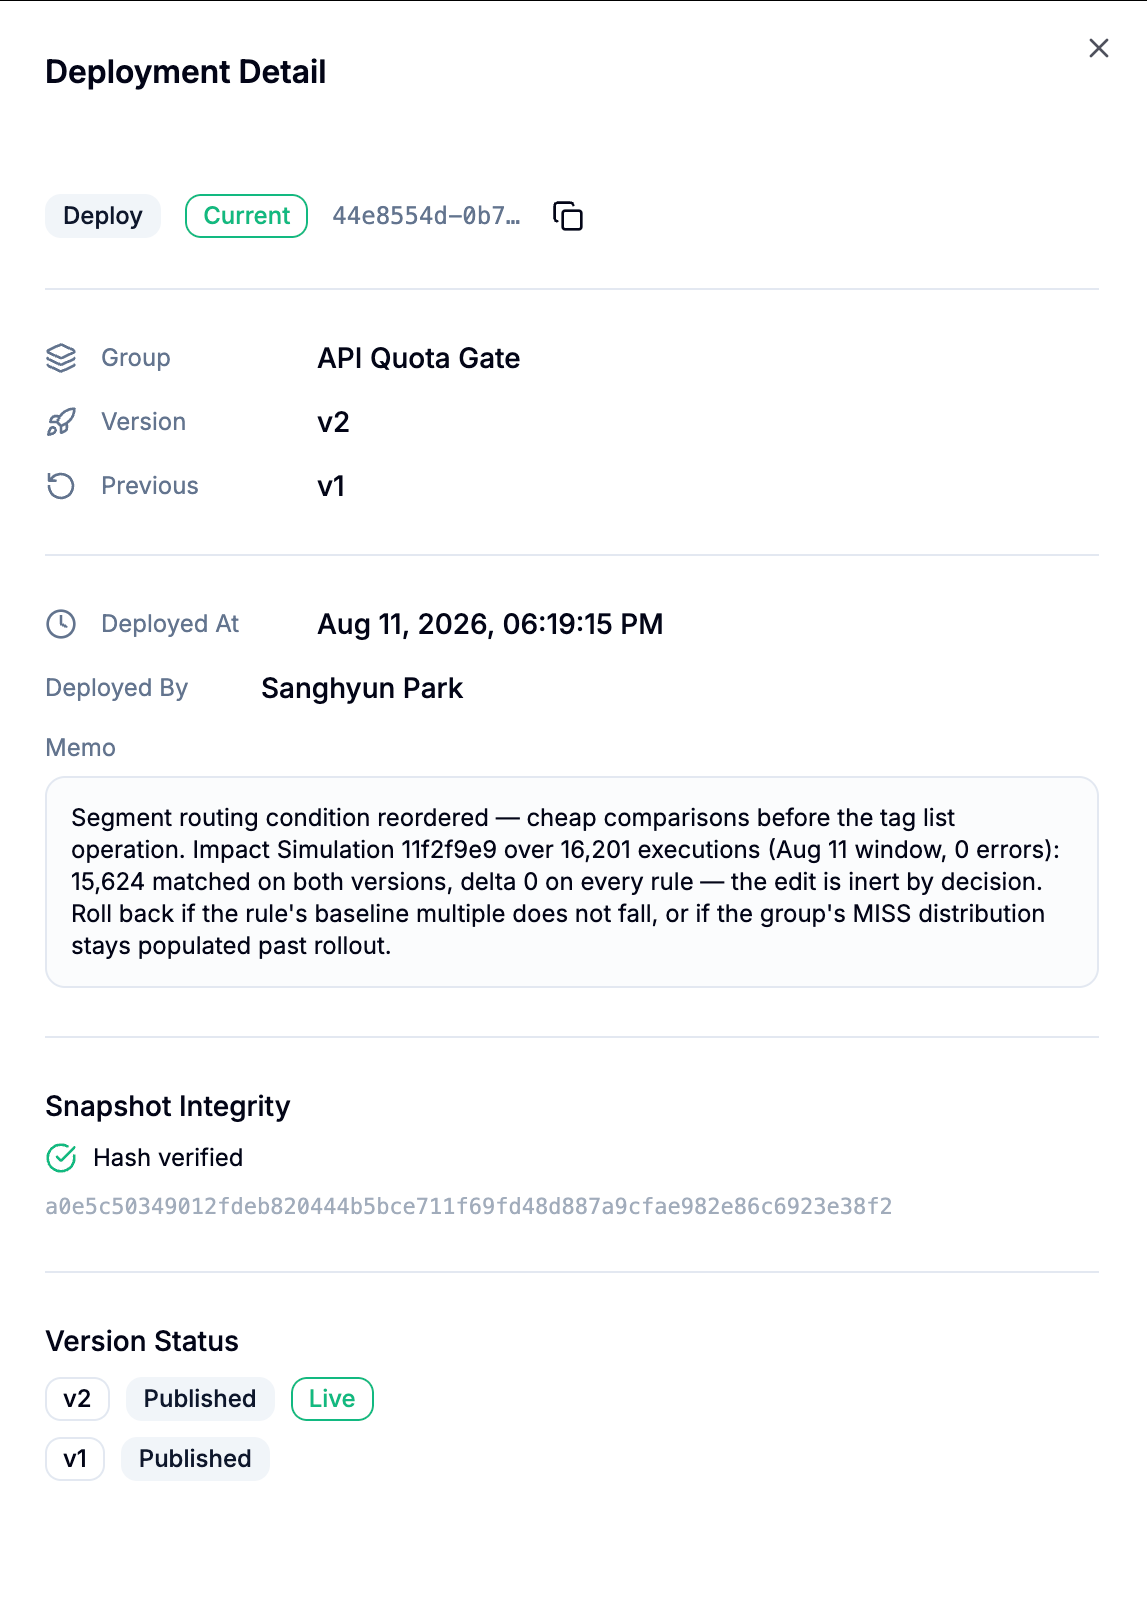
After the deploy, the 30,000 requests run again in their original order, with the same pause. The router's condition p50 stays at 3,583 ns. Over the last five minutes of each run, the group's HIT p50 reads 720,895 ns before and 737,279 ns after. The comparisons now at the front of each set succeed on nearly every request, so almost no set skips the tag scan.
01:54        v1 live
01:54-02:06  30,000 requests: 5 min, 2 min pause, 5 min
02:10        Impact Simulation: 30,020 records, 0 changed
02:15        v2 live; the memo states the prediction and the rollback condition
02:16-02:28  the same 30,000 requests
02:34        v1 live again; the router's condition p50 did not fall
Roll back when the rewritten rule's own p50 does not fall, comparing windows of equal length taken after the first few minutes. Roll back as well when the group's MISS count keeps growing well after the rollout. The engine is then reloading versions more often than deploys explain, and the cost being measured is compilation.
The router's condition p50 does not fall in this run. That calls for a rollback, and v1 goes live again. The memo in the figure states the same rollback condition with the multiple instead, rolling back unless it falls from 2.33×. That test also calls for the rollback, but for the wrong reason: the multiple rises because the median falls. Written on the rule's own p50, the condition gives the same answer for the right reason: no other rule can move that value.
See how LexQ works for yourself in the playground.
Ready to move decisions out of your deploy pipeline?
Try LexQ free, no credit card required.
Start Free